Experiments with Google Fusion Tables
To prep for our talk on data journalism at the Science Online conference coming up next week (!!), I figured it'd be good to actually review mapping some data with Google Fusion Tables. I chose a dataset released this October from the CDC on suicide from 2008-2009. Morbid, I know, but it's is the first time this specific state-level data has been reported, and I wanted to actually visualize the differences between states rather than stare at numbers in a table.
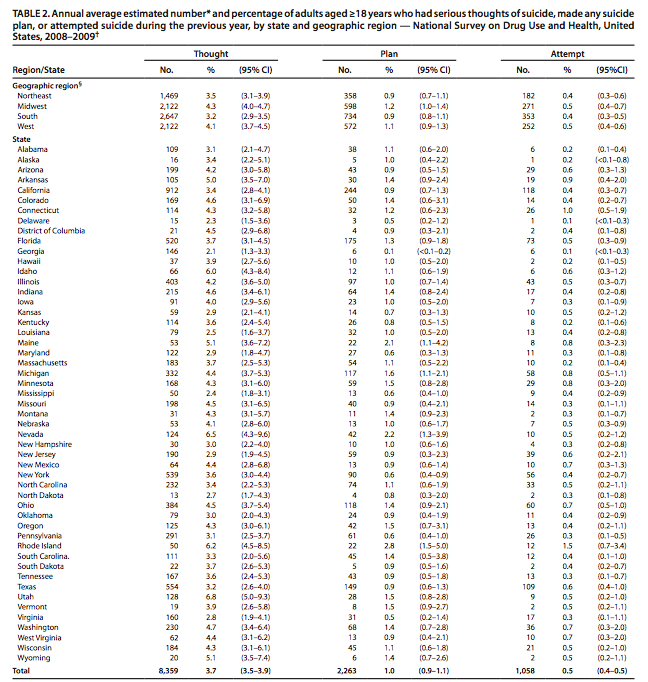
The numbers originally came in a PDF that looked like this:
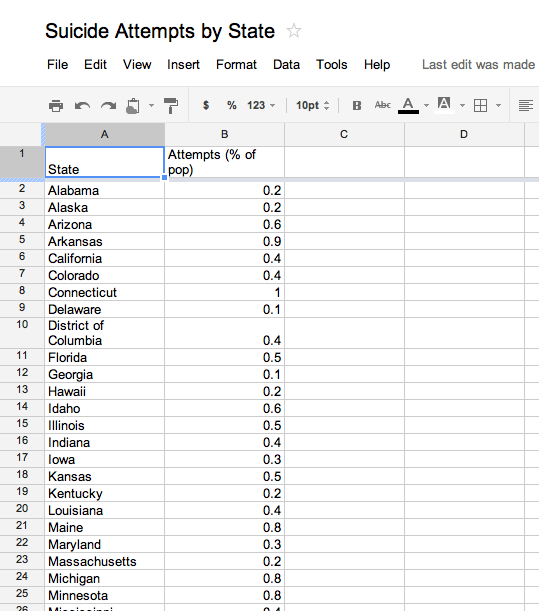
After thinking for a little while that I'd have to do something ninja-like to get them out of the PDF, I just selected all the numbers in the "Attempts" % column, and pasted them into a Google Spreadsheet. Not bad.
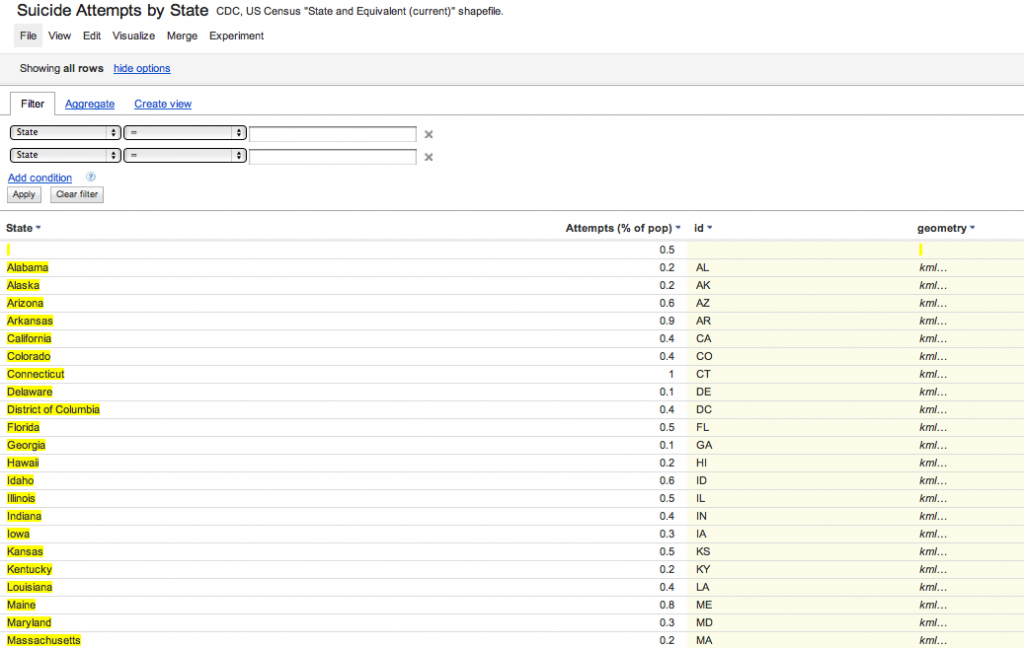
Then I switched over to Google Fusion Tables, and created a new table by importing that very simple Google Spreadsheet. Merging that with the pubic KML file for US states gave me this:

Next was going to Visualize > Map, fiddling around with Configure Styles and adjusting the HTML in the Configure info window to show just the state name and percentage.
Hardly beautiful (and I gotta work out much more coherent step-by-step instructions) but here it is:
Suicide Attempts by State (in % of population)
Now the REAL story here, which the map indicates but does not explain, is why Rhode Island in particular has such a high percentage of suicide attempts. The CDC report offers some speculation, but no definitive answers:
Several theories have been advanced that attempt to explain these regional differences. These theories attribute the differences to selective migration (i.e., populations with risk factors for suicidal behavior might migrate to the same geographic areas), to the sociodemographic composition of the population (i.e., certain regions have a greater percentage of persons who are members of sociodemographic groups that are at greater risk for suicidal behavior), or to the local social environment (e.g., unemployment levels, divorce rates, social support, or environmental factors such as increased access to lethal means). Such variations might point to areas of emphasis for planning and evaluation of prevention activities.
To be continued, then.
